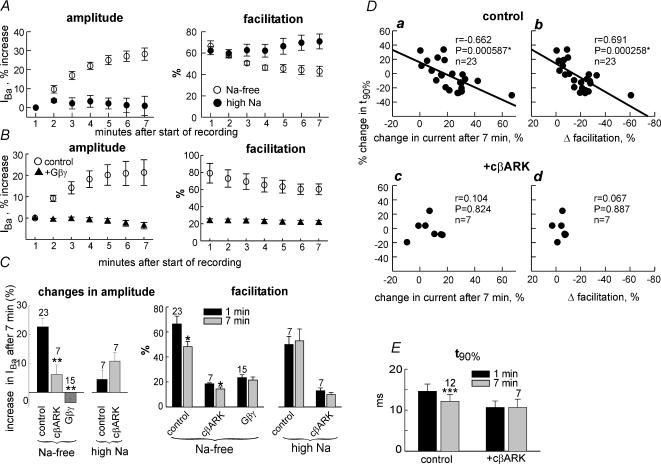
Figure 4. Modulation of N-VDCCs in Xenopus oocytes by Na+ depletion and its Gβγ dependency.
A, time course of changes in IBa (left panel) and in facilitation (right panel), caused by 7min incubation in Na+-free solution (○) or high-Na+ solution (•), in a representative experiment. IBa was: in high-Na+ solution, 849 ± 97 nA at t= 1min and 862 ± 122 nA at t= 7min (n= 4); in Na+-free solution, 845 ± 98 nA at t= 1min and 1075 ± 99 nA at t= 7min (n= 4). In each cell, changes in IBa with time were monitored relative to IBa measured 1min after the beginning of voltage clamp. B, the effect of Na+ depletion on IBa amplitude (left panel) and facilitation (right panel) is altered by overexpression of Gβγ (▴; 5 ng Gβ RNA oocyte−1). ○, channel expressed alone. n= 11–15 oocytes in each group. C, summary of the effects of 7min incubation of oocytes in low- or high-Na+ solutions, in oocytes that expressed N-VDCCs alone (control), with m-cβARK, or with Gβγ. Left panel summarizes the changes in amplitude of IBa. **P < 0.01 compared to control group. Right panel summarizes the changes in facilitation. *P < 0.05 for the difference between 1st and 7th minute. D, t90% of activation shows correlation with the change in IBa (a) and in Δfacilitation (b) after 7min of Na+ depletion. This correlation is absent in oocytes that coexpress m-cβARK (c and d). The value of P was calculated using the Pearson correlation test. E, summary of the effects of depletion on t90% of activation in oocytes that expressed N-VDCCs alone (control) or with m-cβARK. In the control group, only results from cells with more than a 20% increase in IBa after 7min of Na+ depletion (n= 12) are summarized. ***P < 0.001.

