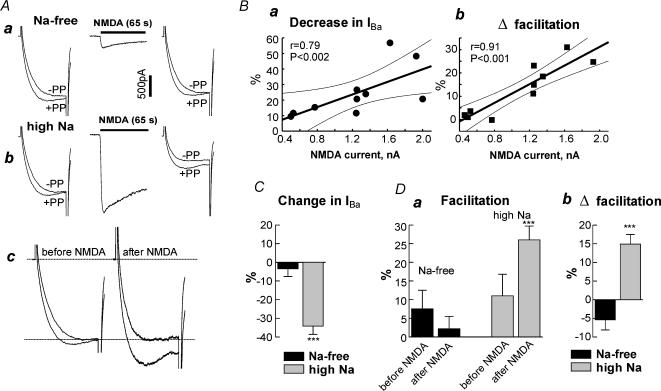
Figure 6. Na+ influx through NMDA receptor channels inhibits N-VDCCs in hippocampal neurones.
A, effect of Na+ entry through NMDA receptor channels. Aa, IBa was measured in a Na+-free solution. The double pulse protocol was as in Fig. 5. NMDA (100μm) was applied in the Na+-free solution for 65 s, washed out, and immediately IBa was measured again. Only the first second of the NMDA record is shown. Ab, continuation of the experiment in the same cell, after shifting to high Na+-solution. The currents measured before and after NMDA are shown again in Ac after the scaling up of IBa recorded after NMDA to that recorded before NMDA. B, correlation of changes in IBa (a) and in facilitation (b) induced by Na+ influx through NMDA receptors with the amplitude of NMDA responses. The straight line is a least squares fit, the dashed lines show 95% confidence intervals. C and D, summary of the effects of Na+ entry through NMDA receptors on amplitude (C) and facilitation (D) of IBa. n= 6 in Na+-free solution and n= 7 in high-Na+ solution. ***P < 0.001.

