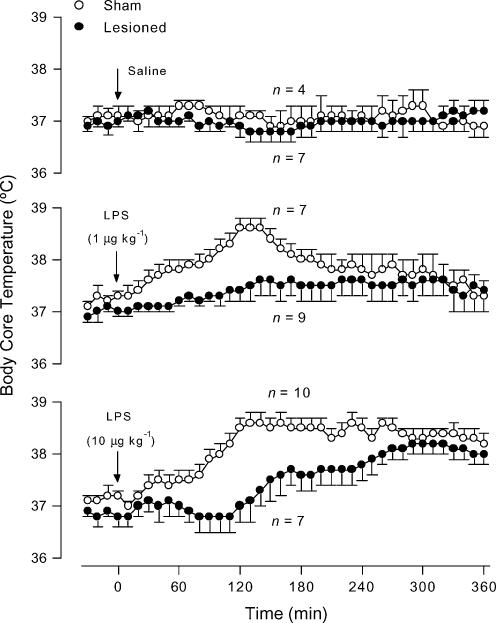
Figure 3. LPS-induced fever in LC-lesioned and sham-operated rats.
The figure shows body core temperature responses to saline (upper panel) and intravenous LPS doses of 1 μg kg−1 (middle panel) and 10 μg kg−1 (bottom panel) of LC-lesioned and sham-operated rats. The experiment was conducted at an ambient temperature of 23°C. The arrows indicate the times of injection. n, number of animals per group.

