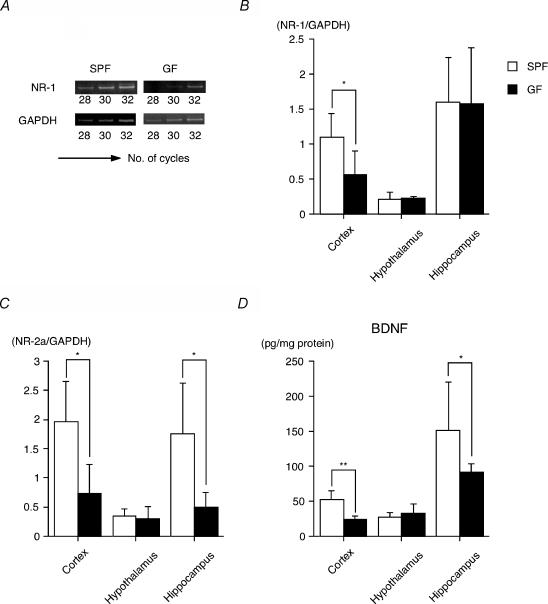
Figure 2. NR subunit gene expression and protein BDNF concentration.
A, a typical RT-PCR product with NR-1 specific primers revealed PCR products with the predicted 333 bp length of NR-1 mRNA. Total RNA was extracted from a single cerebral cortex of GF and SPF mice. NR-1 (B) and NR-2a transcripts (C) were detected by RT-PCR in the cortex, hypothalamus or hippocampus of GF and SPF mice (9 weeks old). Histograms show the relative band intensities on densitometric analysis as ratios of NR subunit and GAPDH mRNA after 30 cycles of amplification (n = 4–7 per group). D, BDNF protein concentration was measured by ELISA (n = 6–10 per group). *P < 0.05, **P < 0.01 by Mann—Whitney U test.

