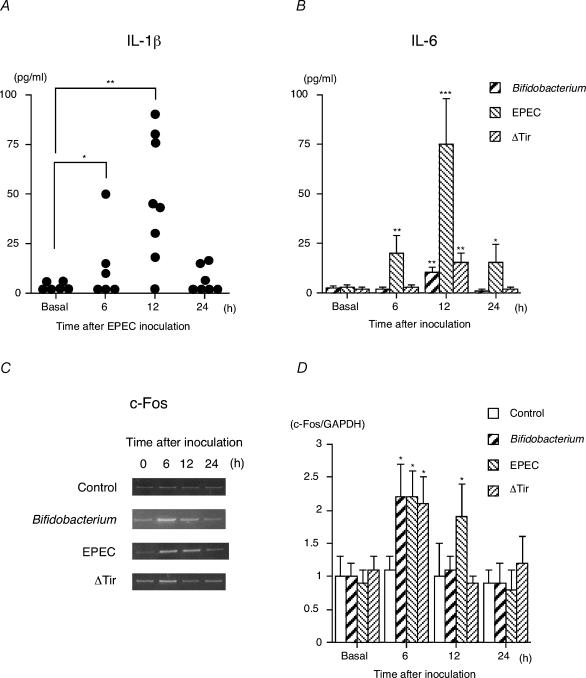
Figure 4. Kinetics of cytokine concentration in the plasma and c-Fos gene expression in the paraventricular nucleus upon exposure to Bifidobacterium infantis, EPEC or ΔTir.
GF mice at 5 weeks of age received a gavage of either 0.5 ml skimmed milk containing one of the bacterial strains (1 × 10⁹ CFU; Bifidobacterium infantis, EPEC or ΔTir) or skimmed milk alone (control), after which plasma and brain samples were collected before (basal) and 6, 12 or 24 h after inoculation with each bacterium. A, the plasma IL-1β level of the mice exposed to EPEC was measured by ELISA (n = 6–8 for each time point). No significant IL-1β elevation in the plasma was found after inoculation with Bifidobacterium infantis, ΔTir or skimmed milk alone (control). B, plasma IL-6 levels were analysed by the B9 cell bioassay as described in the Methods (n = 6–8 for each time point). C, a typical RT-PCR product with c-Fos specific primers revealed PCR products with the predicted 247 bp length of c-Fos mRNA. D, histogram shows the relative band intensities on densitometric analysis as ratios of c-Fos and GAPDH mRNA after 30 cycles of amplification (n = 4 for each time point). *P < 0.05, **P < 0.01 and ***P < 0.001 were considered to be significantly different from the corresponding basal values.

