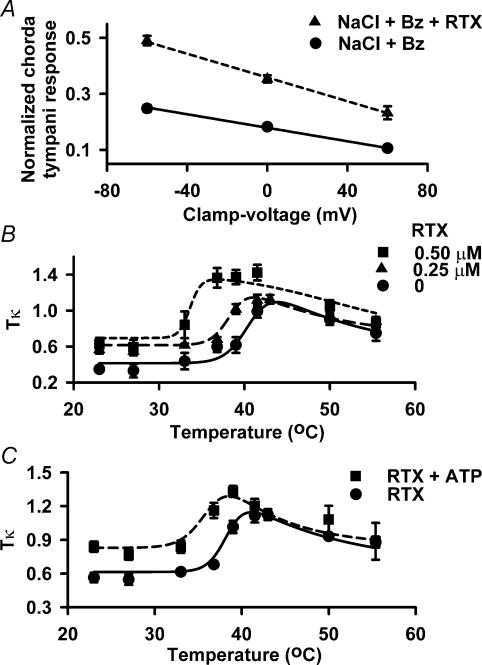
Figure 7. Effect of RTX, temperature and ATP on Tκ values of taste receptor cells in situ.
A, rat chorda tympani responses were recorded during superfusion of the tongue with a rinse solution (10 mm KCl) and with stimulation solutions containing 100 mm NaCl + 5 μm Bz (•; NaCl + Bz) or 100 mm NaCl + 5 μm Bz + 0.5 μm RTX (▴; NaCl + Bz + RTX) at 23°C. In the absence of RTX, n = 8 and in the presence of RTX, n = 4. B, chorda tympani responses were recorded during superfusion of the tongue with a rinse solution (10 mm KCl + 10 mm Hepes; pH 6.0, 23°) and stimulating solutions (10 mm KCl + 100 mm NaCl + 5 μm Bz + 10 mm Hepes; pH 6.0) containing 0 (•), 0.25 μm (▴), and 0.5 μm RTX (▪). For each RTX concentration tested the stimulus solution temperature was varied between 23 and 55.5°C. For 0, 0.25 and 0.5 μm RTX, n = 6, 4 and 3, respectively. C, chorda tympani responses were recorded during superfusion of the tongue with a rinse solution (10 mm KCl + 10 mm Hepes; pH 6.0, 23°C) and stimulating solutions (10 mm KCl + 100 mm NaCl + 5 μm Bz + 10 mm Hepes; pH 6.0) containing 0.25 μm RTX (•), and 0.25 μm RTX + 500 μm ATP (▪). For each RTX and RTX + ATP concentration tested the stimulus solution temperature was varied between 23 and 55.5°C. For 0.25 μm RTX and 0.25 μm RTX + 0.5 mm ATP, n = 4 and 3, respectively. Chorda tympani responses were recorded at zero current clamp (0cc) and at ± 60 mV lingual voltage clamp. In each case the NaCl chorda tympani responses were normalized to the corresponding chorda tympani responses obtained with 300 mm NH4Cl. In B and C the Tκ (product of absolute temperature (K), T, with response conductance (κ) data points were plotted as a function of temperature ranging from 23 to 55.5°C. The Tκ data were fitted toeqn (4) as described in the text. Values are presented as the mean ± s.e.m. of n, where n = number of animals.

