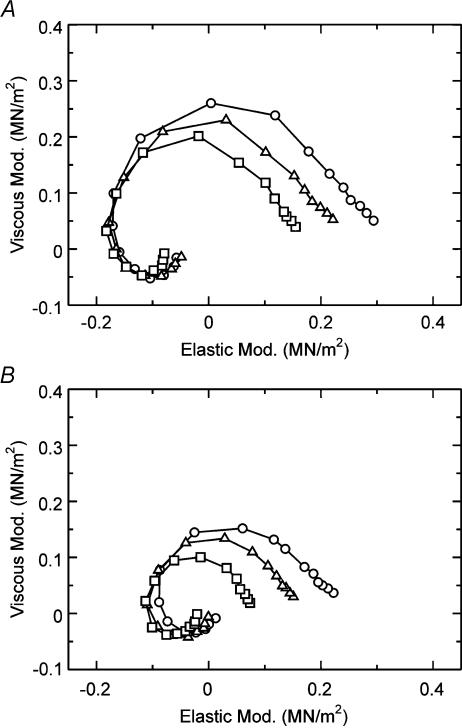
Figure 4. Nyquist plots of the complex modulus of Tm-reconstituted myocardium.
A, the effect of MgATP on the complex modulus Y(f) in Tm-reconstituted myocardium (average of 9 data). ○, 0.1 mm MgATP; ▵, 0.5 mm MgATP; □, 5 mm MgATP. The phosphate concentration was fixed at 8 mm.B, the effect of Pi on the complex modulus Y(f) in Tm-reconstituted myocardium (average of 11 data). ○, 2 mm Pi; ▵, 8 mm Pi; □, 32 mm Pi. The MgATP concentration was fixed at 5 mm. Peak-to-peak amplitude was 0.25%L0. Data are shown in the Nyquist plot, which is a plot of elastic modulus in the abscissa versus viscous modulus in the ordinate. Frequencies used are (clockwise): 0.13, 0.25, 0.35, 0.5, 0.7, 1, 1.4, 2, 3.1, 5, 7.5, 11, 17, 25, 35, 50, 70 and 100 Hz.

