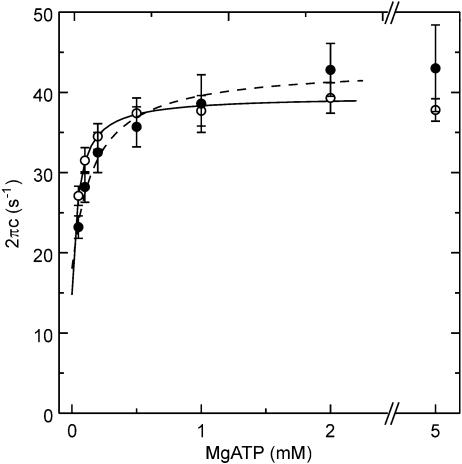
Figure 5. The rate constant 2πc is plotted as a function of the MgATP concentration in Tm- and Tm-Tn-reconstituted myocardium.
○, Tm-reconstituted myocardium (n= 9); •, Tm-Tn-reconstituted myocardium (n= 7). Error bars represent s.e.m. Continuous curves are based on eqn (2) with best fit parameters.

