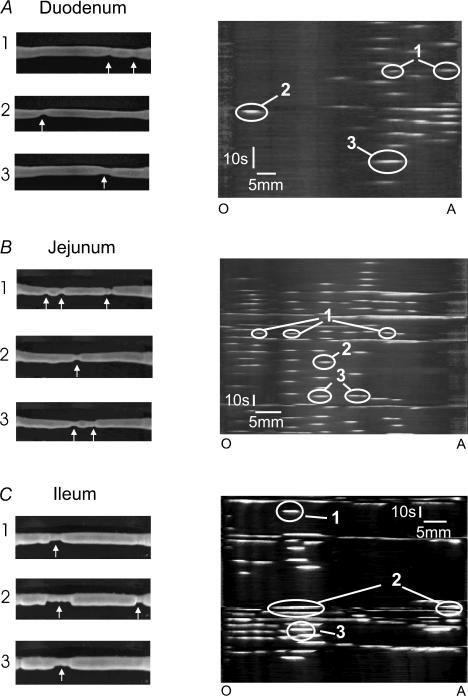
Figure 1. Video images and spatiotemporal maps of motor activity induced in each region of the small intestine by decanoic acid.
The left column shows individual video images taken at three distinct time points for individual segments of duodenum (A), jejunum (B) and ileum (C) in the presence of intraluminal decanoic acid. The arrows indicate constrictions, which were only seen in the presence of the fatty acid. The right column shows the corresponding spatiotemporal maps with the constrictions (white) indicated by arrows in the left column circled. The numbers indicate which video images correspond to particular contractions in the spatiotemporal maps. In this figure. and all subsequent figures the maps are orientated so that the record begins at the top and the oral end (O) of the segment is on the left and the anal end (A) is to the right.

