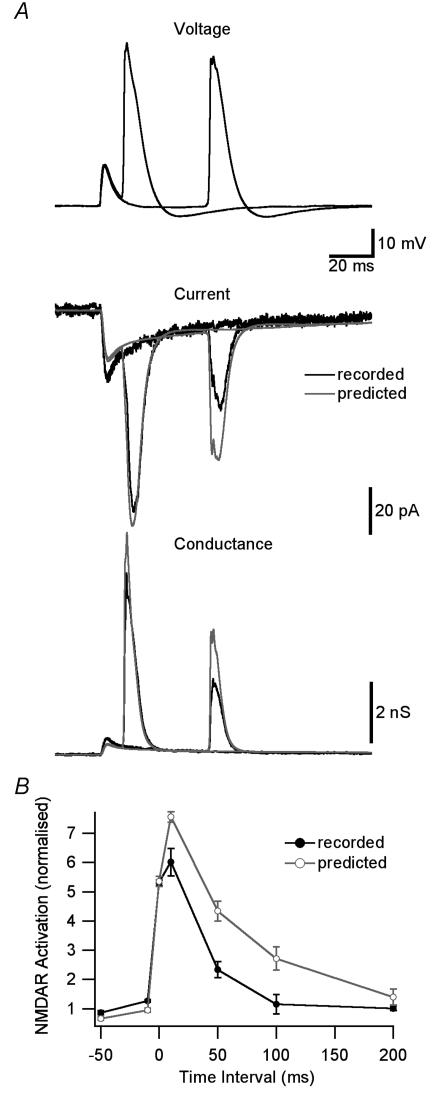
Figure 4. NMDAR activation during STDP induction protocols.
A, top, dendritic voltage (650 μm from the soma) during pairing of an EPSP with a backpropagating AP 10 or 50 ms after EPSP onset. Middle, recorded (black) and predicted (grey, assuming instantaneous Mg2+ unblock) NMDAR current during EPSP–AP pairing. Bottom, recorded (black) and predicted (grey) NMDAR conductance. B, NMDAR activation during EPSP–AP pairing at different time intervals for recorded (black) and predicted (grey) NMDAR currents. Currents were normalized in each patch to the response during 1 ms applications of 1 mm glutamate at +40 mV and the area around the conductance peak (3 ms before to 10 ms after) was used to quantify NMDAR activation.

