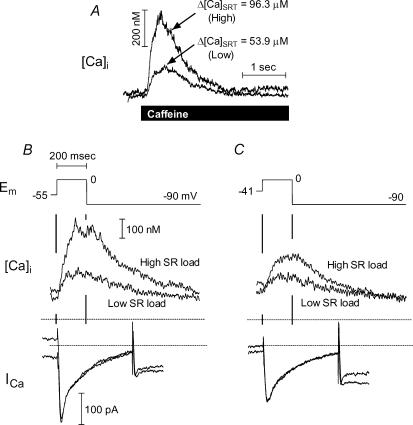
Figure 4. E–C coupling gain increased with SR Ca2+ load at constant trigger strength.
A, Caffeine-induced [Ca2+]i transients showing high and low SR loads. Below are responses at the two loads to two trigger strengths, set with either minimal (B; Vh=−55 mV) or substantial (C; Vh=−41 mV)ICa pre-inactivation. Rabbit cell, control only. This cell subsequently responded robustly to ISO (not shown).

