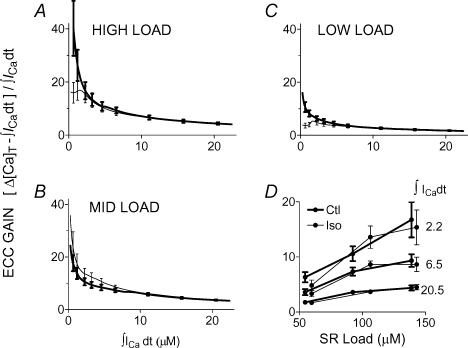
Figure 9. ECC gain did not change with ISO.
The predictions of Fig. 7C have been converted to gain and are shown separately for high (A), medium (B) and low (C) SR load ranges. Each release datum was divided by the corresponding influx. At very large triggers, saturation of release left gain at its smallest and least sensitive to modulation, while small and unsystematic effects are seen in the smallest trigger ranges. D, predictions at three selected Ca2+ influxes are replotted to show that gain increased with increasing SR Load.

