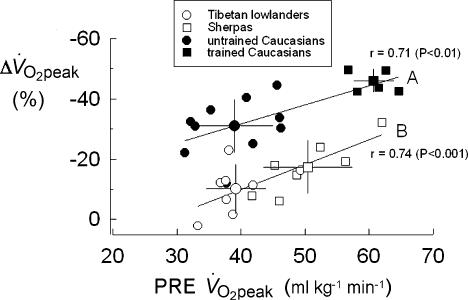
Figure 3. Individual loss of peak aerobic power expressed per kg of body mass (Δ V̇O2peak, %)after 26–28 days (ALT3) at 5050 m, as a function of the corresponding PRE peak aerobic power (V̇O2peak, ml kg− min−).
Mean values ±s.d. of the 4 groups of subjects are also shown (large symbols). Continuous lines (A and B), fitted through individual values, differ significantly from each other (P < 0.05).

