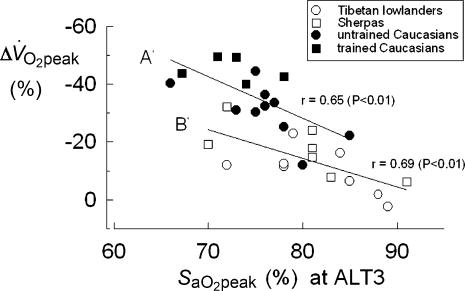
Figure 4. Individual loss of peak aerobic power expressed per kg of body mass (Δ V̇O2peak,%) after 26–28 days (ALT3) at 5050 m, as a function of the corresponding value of arterial O2 saturation (SaO2peak,%) at peak exercise.
Regression equations were determined for untrained and trained Caucasians (A′, P < 0.01) and for Tibetan lowlanders and Sherpas (B′, P < 0.01). The difference between the two equations is statistically significant (P < 0.01).

