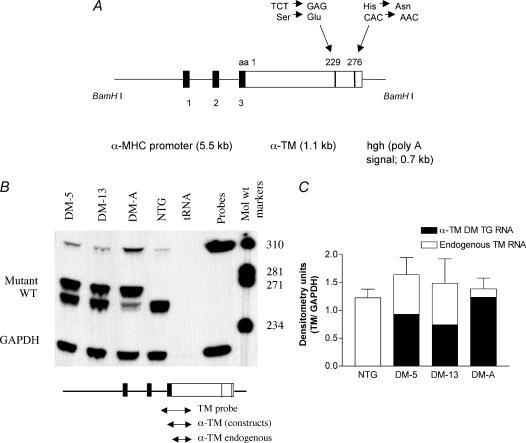
Figure 1. α-TM DM construct and mRNA expression.
A, schematic representation of the TG construct. The mutant TM (Ser229Glu + His276Asn) was linked to the α-MHC promoter (Subramaniam et al. 1991) and used to generate multiple lines of TG mice. The human growth hormone polyadenylation site (hgh poly A) was placed downstream of the TM cDNA. The filled boxes denote the exons derived from α-MHC that encode the 5′-untranslated region. The construct was released using BamH I enzyme. B, RNA expression in TG mice. Total cardiac RNA (20 μg) was hybridized to 3′-radioactively labelled DNA probes specific for either TM (see the small diagram below the RNA gel) or GAPDH. TM probe is 320 bp in length and yields fragments of 277 bp for α-TM DM and 262 bp for endogenous TM RNA after S1 nuclease treatment. The electrophoresed samples shown here contain both mutant and endogenous bands for α-TM DM samples and an endogenous band only for NTG hearts. tRNA was used as a negative control. C, quantification of RNA. NTG and α-TM DM RNA levels were quantified on a PhosphorImager and via densitometry using Bio-Rad's Multi-Analyst software. All three TG lines showed some degree of α-TM DM expression; however, the DM-A line expressed more TG RNA compared with the other two lines.

