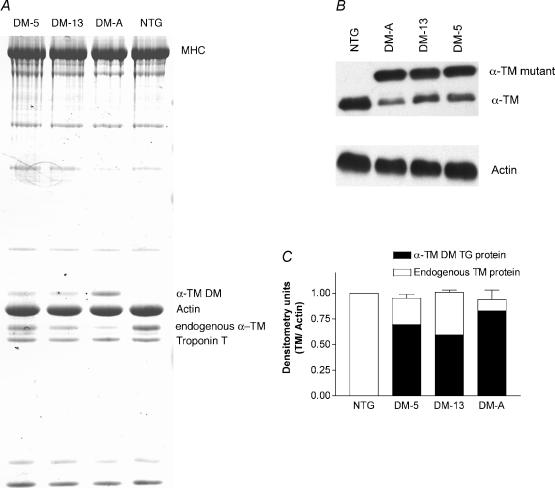
Figure 2. Protein expression in α-TM DM mice.
A, 8 μg of total cardiac myofibrillar proteins from NTG or TG mice were electrophoresed on SDS-PAGE gels containing 3.4 m urea and stained with Coomassie blue. B, Western blot of total myofibrillar proteins electrophoresed on SDS-PAGE gels containing 3.4 m urea. Nitrocellulose filters were first probed with a striated muscle-specific antibody, CH-1, then stripped and reprobed with a sarcomeric actin-specific antibody to verify equal loading for each sample. Note that TG samples contain both α-TM DM and endogenous TM while the NTG sample contains only endogenous TM. C, densitometric analysis of Western blots shown in B. In each sample, total α-TM DM plus endogenous TM was divided by actin amounts and results normalized to NTG. Note that total TM levels were similar for NTG and TG samples.

