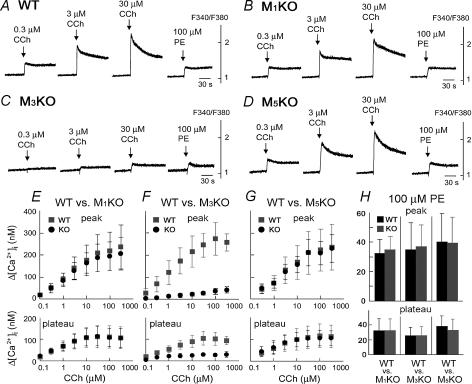
Figure 2. Carbachol (CCh)- and phenylephrine (PE)-induced [Ca2+]i changes in SMG cells from wild-type and KO mice.
A–D, responses in individual representative mice. CCh or PE was applied to the SMG cells at the time point indicated by the arrow. The results shown are representative of 4 experiments. E–H, summarized peak [Ca2+]i (upper panel) and plateau [Ca2+]i (lower panel) increases induced by CCh (E–G; grey square: WT, black circle: KO) or PE (H; black column: WT, grey column: KO) in M1-, M3-, or M5-deficient mice (mean ± s.d.; n = 4 for each genotype). The [Ca2+]i was calculated using the equation described by Grynkiewicz et al. (1985). Control responses were measured in WT controls for each genotype.

