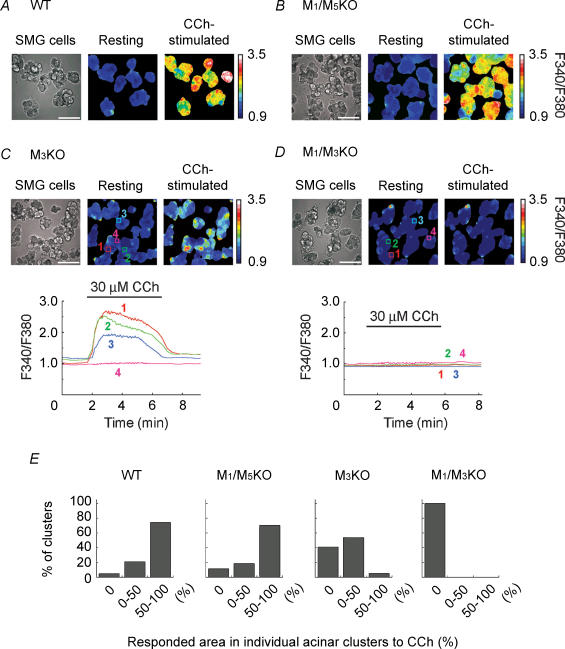
Figure 5. Ca2+ imaging in individual SMG acinar cell clusters and effect of CCh.
A–D, image of SMG acinar cell clusters and pseudo-colour images of F340/F380 under resting and CCh-stimulated (30 μm) conditions are shown (A, WT; B, M1/M5 double KO; C, M3KO; D, M1/M3 double KO SMG). Scale bars indicate 100 μm. Lower panels in C and D show the [Ca2+]i changes at regions 1–4 depicted in the upper panels. The results shown in A–D represent at least 8 separate measurements for each genotype. E, summarized responses of individual acinar cell clusters induced by 30 μm CCh in WT, M1/M5 double KO, M3KO, or M1/M3 double KO SMG acinar cell clusters. Proportion of clusters categorized into three groups based on the responding area (0, 0–50 and 50–100%) as a precentage of the total number of clusters for each genotype was shown.

