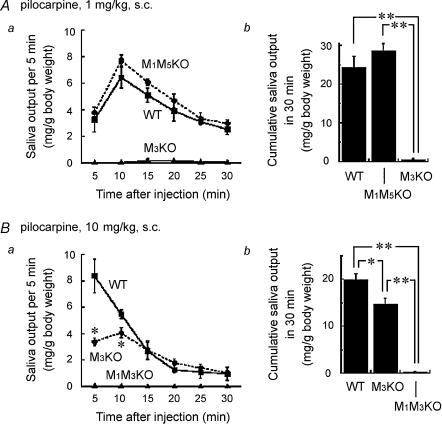
Figure 6. Cholinergically stimulated salivation in WT, M1/M5KO, M3KO and M1/M3KO mice.
The saliva output in each 5 min period after stimulation is represented by the symbols and lines in the left panel (a) and the cumulative amount in 30 min in the right panel (b). A, salivation in response to 1 mg kg−1 of pilocarpine (s.c.) in WT (n = 5), M1/M5 double KO (n = 4) and M3KO (n = 5) mice. B, salivation in response to 10 mg kg−1 of pilocarpine (s.c.) in WT (n = 5), M3KO (n = 5), and M1/M3KO (n = 4) mice. The results are presented as the mean ± s.e.m.; some of the error bars are hidden by symbols. Statistical analysis was made using Scheffe's multiple comparisons following one-way ANOVA. In Aa, the values at all time points in M3KO mice showed a statistically significant difference (P < 0.01), compared to WT or M1/M5 double KO mice. In Ba, significantly smaller values in M3KO mice are depicted by asterisks (*P < 0.05, compared to WT), while the values at all time points in M1/M3 KO mice show statistically significant difference (P < 0.01, Student's t test), compared to WT or M3KO mice. In b, significantly smaller values were depicted by asterisks (*P < 0.05 and **P < 0.01).

