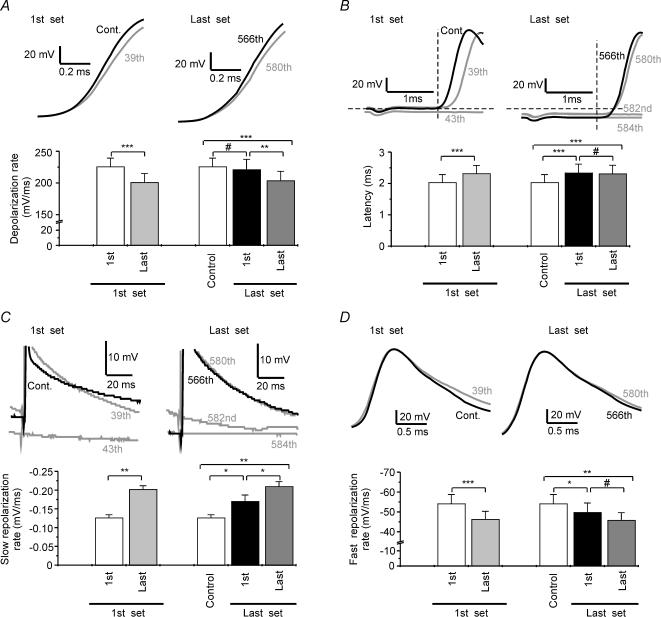
Figure 7. Patterns of changes in AP waveform during 10 Hz stimulation.
A, top: sample traces of the first (black lines) and the last (grey lines) AP of the first and the last set of APs normalized to the AP onset. A, bottom: summary graph of the depolarization rate at different moments of the tetanus (n = 7) in experiments with AP failures. B, top: traces of the same cell as in A but without normalization to the AP onset and at different time scales. B, bottom: summary graph of the latency values at different moments of the tetanus (n = 7) in experiments with AP failures. C, top: the same traces as in B but AP amplitudes have been truncated. C, bottom: summary graph of the slow repolarization rate values at different moments of the tetanus (n = 7) in experiments with AP failures. D, top: sample traces normalized to the amplitude of the first AP of the corresponding set of APs to allow a better comparison of the repolarizing rate. D, bottom: summary graph of the fast repolarization rate values at different moments of the tetanus (n = 7) in experiments with AP failures. White bars in summary graphs represent control (last pulse before tetanic stimulation) values. Note that these values coincide with those we also called 1st AP of the 1st set. The first set refers to the first group of successful action potentials and the last set to the last group of successful APs that precedes an AP failure. All recordings plotted with black lines show the first AP of each set of successful APs. For clarity, each AP is labelled with its ordinal number in the tetanus. 39th and 580th pulses represent the last AP of each set of successful APs. * P < 0.05, ** P < 0.01, *** P < 0.001, significant differences (Student's paired t test); # non-significant differences.

