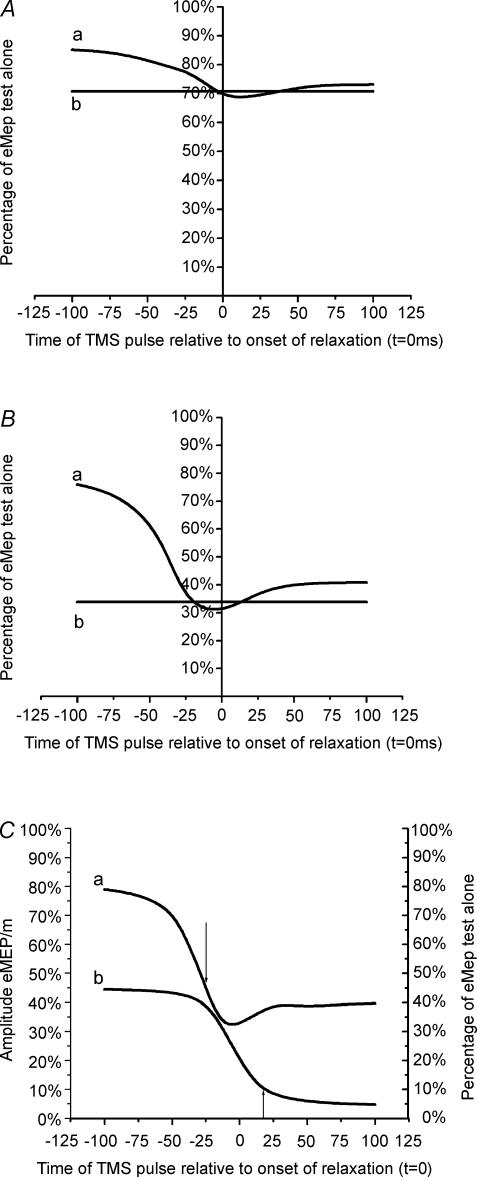
Figure 4. Mean time courses of the estimated SICI (eSICI; curve a) and the mean value of SICI at rest during the experiment (curve b) in eight subjects.
A shows data with conditioning intensities of 80% AMT. B shows data with conditioning intensities of 100% AMT. C, compares the time course of eSICI at 100% AMT (right Y-axis, curve a) with the time course of the change of the unconditioned eMEP (left Y-axis, curve b). The arrows indicate the TNSD in the eSICI and the eMEP.

