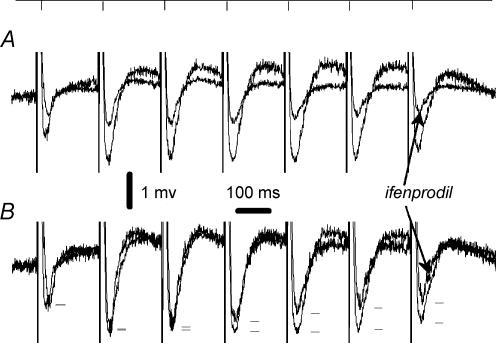
Figure 7. Pharmacologically isolated field EPSPNMDA measured during the course of 5 Hz stimulation.
A, the traces of the EPSPNMDA induced by a train 7 pulses long (5 Hz) in control conditions and in the presence of 50 μm ifenprodil (superimposed). B, corresponding traces were normalized. The peak values of individual EPSPs are marked with dashes to demonstrate a gradual pulse-to-pulse increase in the contribution of ifenprodil-sensitive component of the signal.

