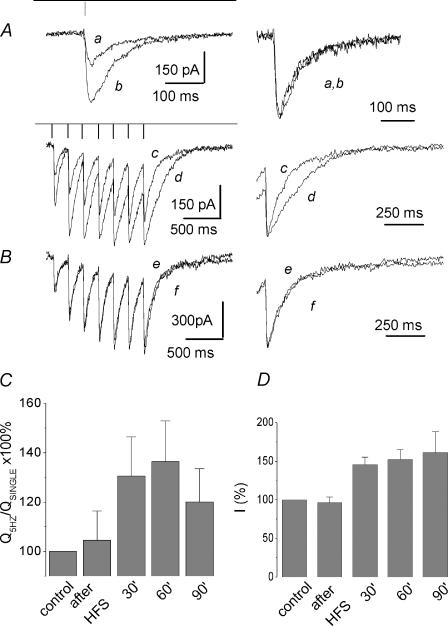
Figure 8. Long-term enhancement of the delayed component of the afterburst EPSCNMDA after HFS.
A, left-hand traces: EPSCNMDA induced by single stimuli (traces a and b) and by a 5 Hz train 7 pulses long (traces c and d) before (traces a and c) and 60 min after HFS (traces b and d). HFS stimulation protocol was as follows: train 7 pulses long (200 Hz) was applied 6 times with 20 s intervals. Holding voltage was −45 mV. Right-hand traces: corresponding EPSCNMDA scaled to the same amplitude and superimposed as indicated. B, control experiment demonstrating the lack of slow-down of the EPSCtrainNMDA in the course of long-term measurements (90 min) in the absence of HFS. The EPSCNMDA induced by a train (5 Hz) 7 pulses long before (trace e) and after 90 min of the whole-cell recording (trace f). Both traces exactly coincide, as seen in the normalized superposition at a higher sweep speed (right-hand traces). C, train-to-single ratio of the normalized charge to the peak charge transfer measured in control conditions, immediately after HFS and successively at 30, 60 and 90 min after HFS (calculated as  ). D, averaged amplitude of the EPSCNMDA induced by single stimulus measured in control conditions, immediately after, and at 30, 60 and 90 min after HFS.

