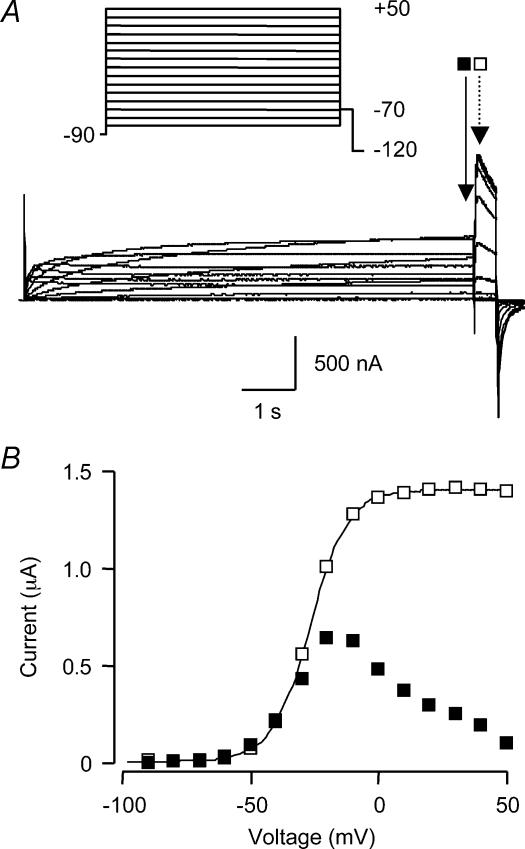
Figure 2. Steady-state activation of WT HERG.
A, typical example of currents recorded from WT HERG channels during an 8 s steady-state activation voltage protocol (see inset). Arrows indicate points at which current was measured for the depolarization step (continuous line) and for the tail currents (dashed line). B, the current–voltage (I–V) relationships for the current recorded at the end of the depolarization steps (filled symbols) and tail currents (open symbols) plotted against the voltage of the preceding voltage step. The reduction in outward current at positive potentials seen during the depolarization step results from inactivation of the channels. The curve fitted to the tail current data is a Boltzmann function (see Methods) with a V0.5 of activation of −28 mV.

