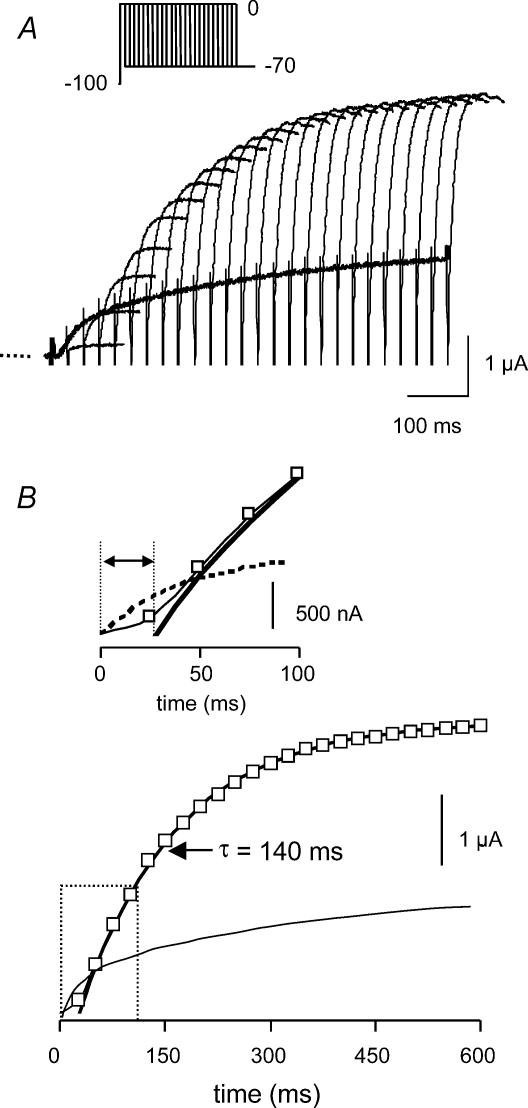
Figure 4. Rate of activation at 0 mV for WT HERG.
A, typical example of currents recorded using an envelope of tails protocol (inset) to measure the rates of activation at 0 mV for WT HERG channels. B, peak tail currents plotted against the duration of the preceding depolarization to 0 mV. The dotted line shows the current recorded during a simple depolarization to 0 mV which clearly has a different shape, due to the overlap of activation and inactivation. The time constant for the single exponential fitted to the latter half of the activation time course in this example was 140 ms. The inset shows an expanded view of the first 100 ms of the plot (dashed box). The amplified plot highlights the sigmoidal activation time course.

