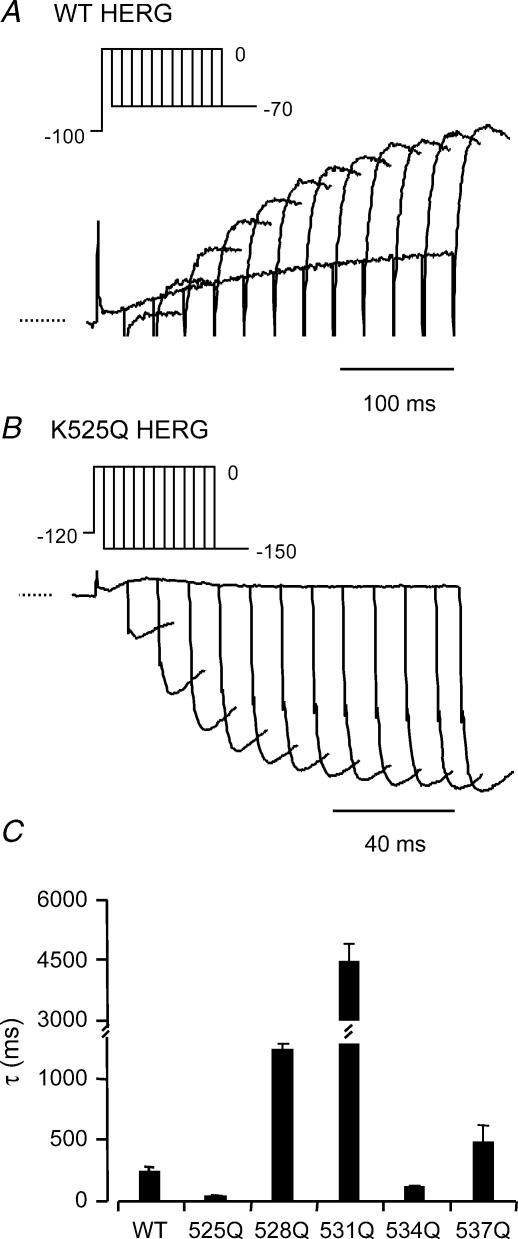
Figure 5. Summary of rates of activation at 0 mV.
Typical examples of currents recorded from WT (A) and K525Q (B) during an envelope of tails protocol (see insets) to measure the rates of activation at 0 mV. Note different time scales for current traces in A and B. C, means ± s.e.m. for the time constants. The rate of activation at 0 mV was fastest for K525Q (44 ± 9 ms) and slowest for R531Q (4382 ± 541 ms) (see Table 2).

