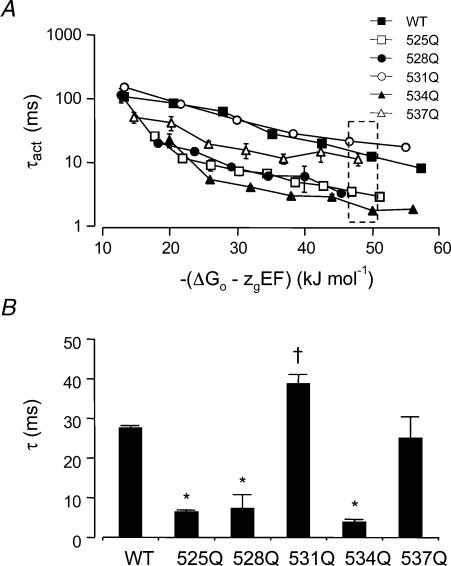
Figure 6. Time constants of activation versus total potential driving force.
A, time constants of activation for WT and S4 charge mutant channels were obtained at voltages in the range +40 to +120 mV (WT), to +140 mV (R531Q) or to +160 mV (K525Q, R528Q, R534Q and R537Q) and are plotted versus the total potential driving force, i.e. −(ΔG0–zgEF). B, time constants of activation for WT and S4 charge mutants at a potential energy driving activation of ∼50 kJ mol−1 (see dashed box in A). τ values are significantly faster (*), or slower (†) than WT (P < 0.05, ANOVA followed by Dunnett's method).

