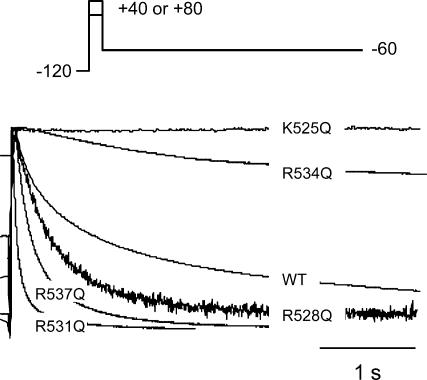
Figure 7. Rates of deactivation at −60 mV for WT HERG and all mutants.
Typical examples of tail currents recorded at −60 mV following a step to +40 or +80 mV (in case of R531Q) to activate the channels are illustrated. To facilitate comparison of the rates of deactivation, current traces have been normalized to the peak tail current. In the traces shown, the currents for K525Q and R534Q decay more slowly than for WT, which in turn is slower than for R528Q, R537Q and R531Q.

