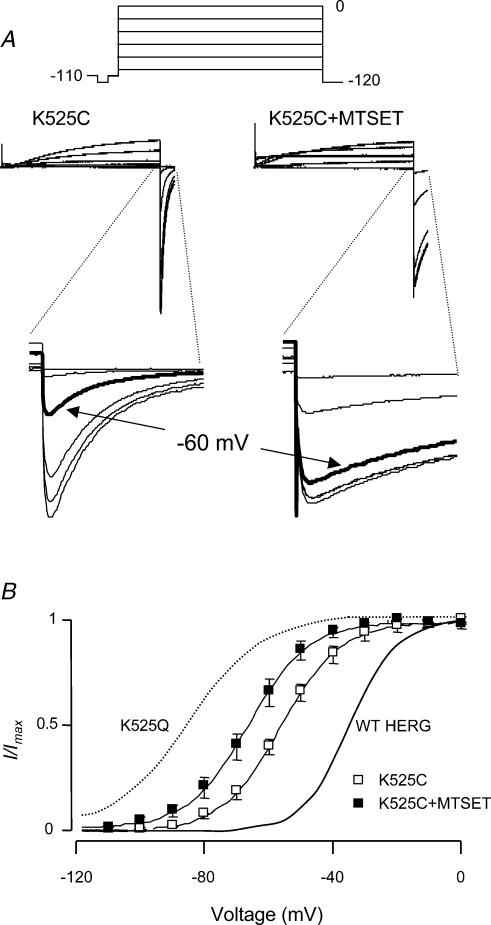
Figure 10. Steady-state activation of K525C ± MTSET.
A, typical examples of currents recorded from K525C before and after modification with MTSET during a steady-state activation protocol (inset). The tail currents are highlighted in the insets. At −60 mV (bold traces), the K525C channels were less than 50% activated whereas K525C + MTSET was greater than 50% activated. B, mean steady-state activation curves for K525C before and after modification with MTSET. The mean value for V0.5 for K525C channels was −54.4 ± 0.7 mV; this was significantly different from WT (−34 ± 1.6 mV, continuous thick line). Addition of MTSET to K525C caused a further leftward shift in V0.5 of steady state activation (−66.2 ± 2 mV, n = 6, P < 0.05 compared to K525C, paired t test) but it was not as far shifted as K525Q (dotted line).

