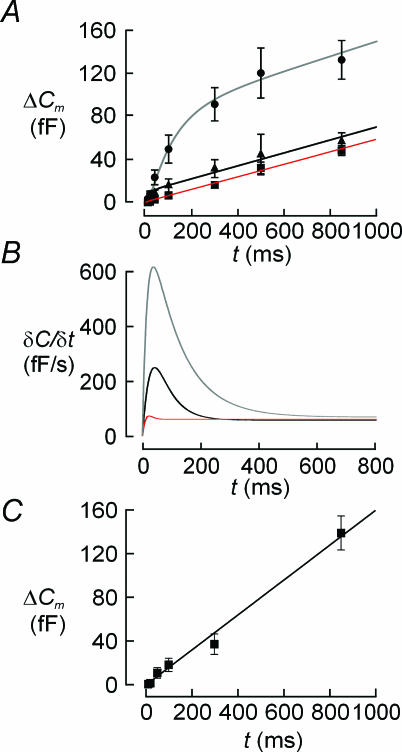
Figure 4. Distinct release kinetics of α-, β-and δ-cells in intact islets.
A, relationships between pulse duration (t) and depolarization-evoked capacitance increases (ΔC) in pancreatic δ-cells (•), α-cells (▴) and β-cells (▪). Data are mean values ±s.e.m. recorded from 48 δ-cells, 15 α-cells and 140 β-cells. The curve superimposed on data points was derived by approximating eqn (3) in Barg et al. (2001) to the observed values. B, time course of exocytosis in δ-cells (top curve), α-cells (middle curve) and β-cells (lower curve) obtained by calculating the time derivative (δC/δt) of the continuous curves superimposed on data points in panel A. C, time course of exocytosis in the 14% of β-cells showing the largest exocytotic responses (n = 20).

