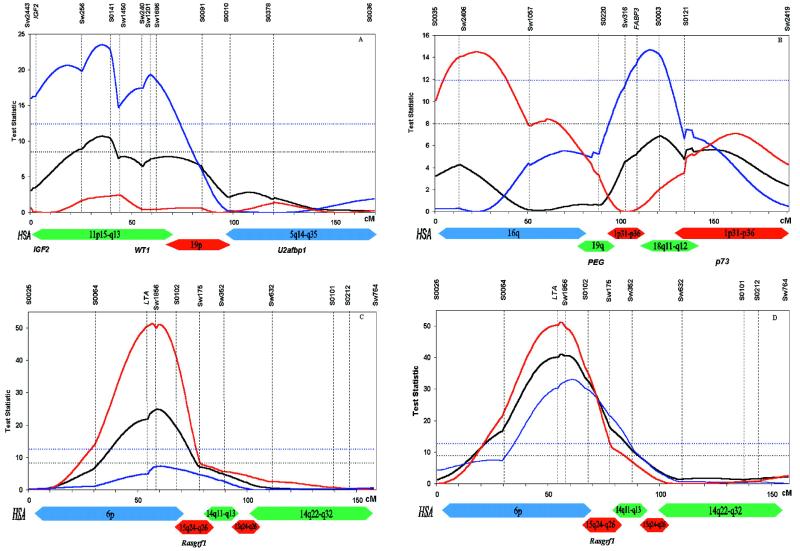
Figure 1.
Test statistic profiles for three porcine chromosomes that exhibit imprinting effects for one of the body composition traits: SSC2 and back fat thickness (A), SSC6 and intramuscular fat content (B), SSC7 and muscle depth (C), and SSC7 and back fat thickness (D). The black line represents the test statistic for a Mendelian QTL vs. no QTL. The blue line represents the test statistic for a paternally expressed QTL vs. no QTL. The red line represents the test statistic for a maternally expressed QTL vs. no QTL. The black horizontal line denotes the 5% genome-wise threshold for the Mendelian model, and the blue line indicates the same threshold for the imprinting models (thresholds for maternal and paternal expression were very similar and well within the sampling variance associated with permutation testing). Homologous regions in humans are indicated as colored bars (22–24, 26).‡ Imprinted genes located within these human chromosomal areas are listed at the bottom (5, 25).

