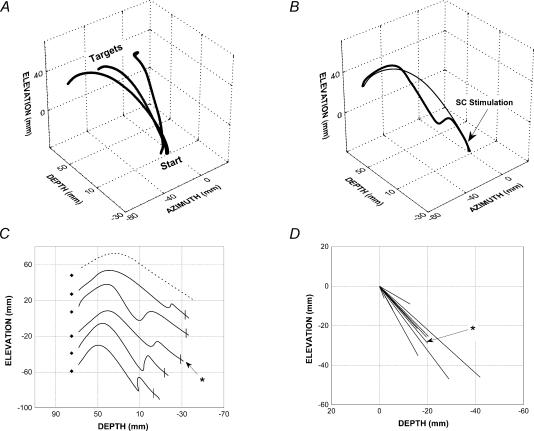
Figure 1. Trajectories of selected forelimb reaching movements (session Y1).
A, 3-D averaged trajectories of unperturbed movements directed toward the 3 targets. After synchronization on movement onset, the trajectory of 7, 10 and 4 individual responses to the left, centre and right targets, respectively, were pooled. B–D, forelimb responses to the left target recorded in session Y1. B, 3-D trajectories of an individual perturbed response (thick line, stimulation parameters: 300 Hz, 100 ms, 12 μA) and of the average of control responses (thin line). C, lateral view of different perturbed responses (continuous line) and of a typical control response (dashed line). Target centre positions are shown by diamonds. The perturbed response shown in B is indicated by the asterisk. D, lateral view of perturbation vectors. The vector of the perturbed movement shown in B and C is indicated by the asterisk. Note the different scales as compared to C.

