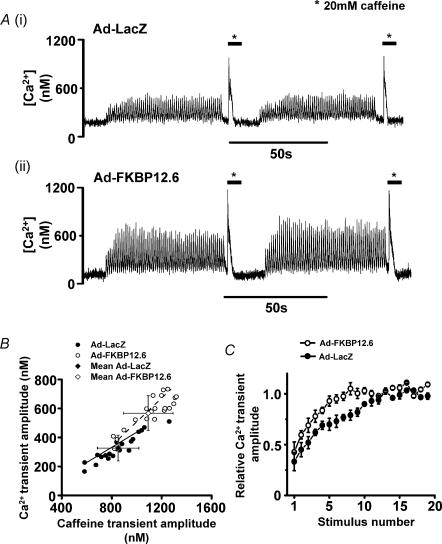
Figure 1. Ca2+ transients and caffeine-induced Ca2+ release.
A, intracellular [Ca2+] signals recorded 48 h after transfection with (i) Ad-LacZ (ii) Ad-FKBP12.6. B, a plot of caffeine-transient amplitude versus Ca2+ transient amplitude for individual cardiomyocytes from both Ad-LacZ (•) and Ad-FKBP12.6 (○) groups. Mean values (± s.d.) for both groups are shown by grey diamond symbols. The lines represent the best-fit linear correlation to the data: continuous line gradient (Ad-LacZ) = 0.50 ± 0.03(± s.d.); dashed line gradient (Ad-FKBP12.6) = 0.61 ± 0.07(± s.d.). C, time course of recovery of Ca2+ transient after a rest period; Ca2+ transients normalized to amplitude achieved in steady state; values are expressed as mean ± s.e.m., n = 20 in each group (○, Ad-FKBP12.6; •, Ad-LacZ).

