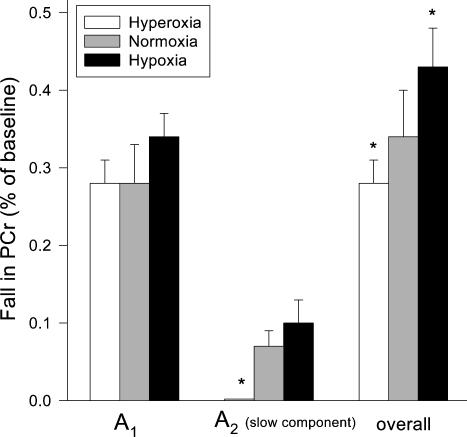
Figure 3. The effect of FIO2 on the phase I, phase II and overall PCr amplitudes.
The amplitude of the initial phase I fall of PCr (A1), expressed as a fraction of resting PCr, was not different as FIO2 was increased. A slow component of PCr was present at FIO2 of 0.1 and 0.21 (A2). The overall fall in PCr, both A1 and A2, increased significantly as FIO2 was decreased.

