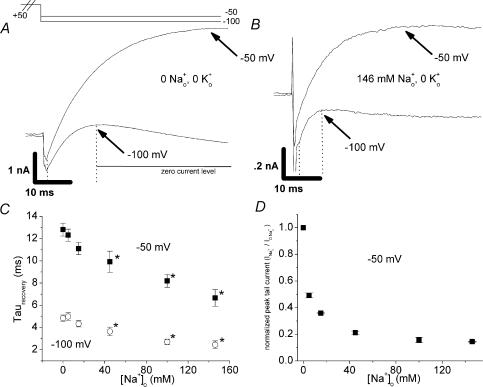
Figure 1. Effect of Na+o on HERG recovery from inactivation in the absence of K+o.
Membrane potential was stepped from −80 mV to +50 mV (2 s), followed by test potentials of −50 or −100 mV. A and B, representative currents at hyperpolarized test potentials for a paired experiment in which [Na+]o was changed from 0 (A) to 146 mm (B), with [K+]o held at 0. The currents in 146 mm Na+o were much smaller than those in 0 Na+o (note current scale is different while time scale is identical). Experiments as in A and B were carried out with several concentrations of Na+o. The early, increasing phase reflecting recovery from inactivation (ending at the point indicated by arrows) was fitted with a single exponential. Time constants at several [Na+]o are plotted in C (n = 4–5, paired observations). For test potentials of both −50 mV and −100 mV, recovery time constants were significantly smaller than baseline ([Na+]o= 0) for [Na+]o≥ 40 mm (P < 0.05). D, Na+o concentration–response relationship in the absence of K+o for peak tail current at −50 mV. Normalized peak tail current (INa/I0Na) is plotted on the y-axis. Note that the IC50 of 4.2 ± 1.2 mm is similar to that previously measured at +20 mV (Numaguchi et al. 2000a; Mullins et al. 2002) (see also Fig. 2A and inset).

