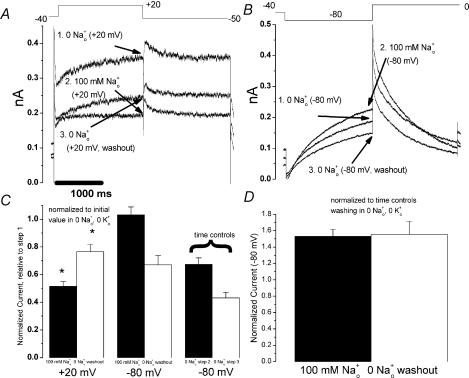
Figure 4. Na+o effects on depolarization- and hyperpolarization-activated currents in HERG D540K.
A, representative currents from an experiment examining Na+o effects on depolarization-activated D540K current. From a holding potential of −40 mV, cells were stepped to +20 mV for 2 s, followed by a 2 s step to −50 mV. Current was recorded in three consecutive solutions, as shown. B, representative currents from an experiment examining Na+o effects on hyperpolarization-activated D540K current. From a holding potential of −40 mV, cells were stepped to −80 mV for 2 s, followed by a 2 s step to 0 mV. Current was recorded in three consecutive solutions, as shown. C, summarized data from several experiments as in A (n = 10) and B (n = 8). Current at the end of the first 2 s voltage step (arrows, A and B) was normalized to the initial value (‘step 1’) in 0 [Na+]o, 0 [K+]o. While significant inhibition of depolarization-activated currents (+20 mV) by 100 mm[Na+]o was observed (I100mM/I0mM = 0.52 ± 0.03) and much of the inhibitory effect could be washed out (Iwashout/I0mM= 0.77 ± 0.05, P < 0.01 versus I100mM/I0mM), no significant inhibition of hyperpolarization-activated current was observed (−80 mV, I100mM= 1.03 ± 0.06). C also includes summarized data from time control experiments (n = 4) in which solution containing 0 [Na+]o was washed in twice (step 2, step 3). These time control data were used to calculate the ‘doubly normalized’ data in D, which suggest that 100 mm[Na+]o actually increases hyperpolarization-activated currents measured at −80 mV (I100mM/Itimecontrol = 1.53 ± 0.08, P < 0.01 versus 1).

