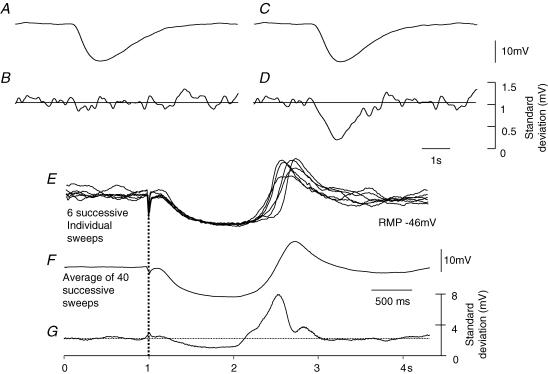
Figure 9. Change in standard deviation of membrane noise during a nitrergic IJP recorded from the circular layer of guinea-pig proximal colon.
The upper two sets of traces illustrate calculations which show the effect of the nitrergic component of the IJP on the standard deviation if it was assumed to result from an increase in gK (A and B) or if it was assumed to result from a decrease in the discharge of unitary potentials by ICCIM (C and D). For details of calculations see Methods. Note that if the IJP resulted from an increase in gK, the standard deviation was unchanged during the IJP. Conversely if the IJP resulted from a decrease in the discharge of unitary potentials by ICCIM, the standard deviation fell during the IJP. The overlaid experimental traces shown in panel E show 6 successive responses to nerve stimulation; the average of 40 successive sweeps is shown in F. When the mean standard deviation for the successive 40 traces was calculated (G), it was found that the standard deviation fell during the IJP and increased during the rebound potential. The lower time, and current calibration bars apply to experimental observations. Apamin (0.1 μm) atropine (1 μm) and nifedipine (1 μm) were present throughout.

