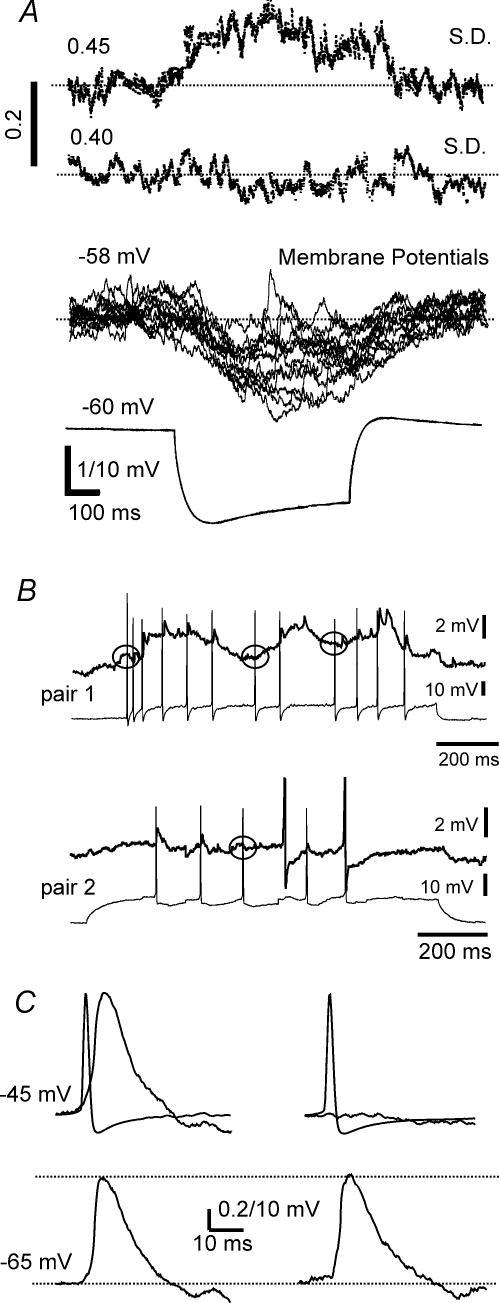
Figure 4. Increased variability of the electrotonically transmitted voltage responses in the coupled cell compared to the current injected cell.
A, increased variance of passive, non-current-injected coupled neurone shown by the standard deviation of the membrane potential calculated from 16 consecutive sweeps. The upper trace represents the standard deviations of the membrane potential in the electrotonically coupled cell, while the second line illustrates those in the current injecting cell. Note the marked increased standard deviations in the upper trace during the time of the current injection into the coupled neurone The lower 2 traces are the corresponding membrane potential responses to hyperpolarizing current pulses in the coupled cells, showing increased voltage fluctuations in the passive non-current injected receiving neurone. B, spikelets could be evoked in s.o. interneurones by spikes in the electrotonically coupled cell, with intermittent failures. The spikes, shown in the lower traces of two separate examples of paired recordings of coupled neurones, evoked corresponding spikelets in the coupled cell shown at a higher gain in the upper traces. However, not all spikes elicited corresponding spikelets in the electrotonically coupled cell as denoted by circles showing absence of evoked spikelets in the electrotonically coupled cell. Pair 1 was in normal ACSF, and pair 2 was perfused with ACSF containing synaptic transmission blockers CNQX (20 μm), AP5 (25 μm) and bicuculline (20 μm). C, spikes in an s.o. interneurone evoke spikelets in the other electrotonically coupled neurone. The upper left traces are averaged data triggered by 110 spikes from the current injected cell. The averaged spike is the briefer event and the mean spikelet is a more prolonged postsynaptic potential shown at a much higher gain (0.2 mV calibration). Failures of the spike to produce a spikelet in the current receiving cell (in this example, 6 out of 110) were rejected from this average and are shown as averaged data in the left upper 2 traces. In the lower 2 traces, spike-triggered average data, each from 50 spikelets at two different membrane potentials in an s.o. interneurone, show that the peak spikelet amplitude is independent of the membrane potential. In these examples, the parental spikes are not superimposed.

