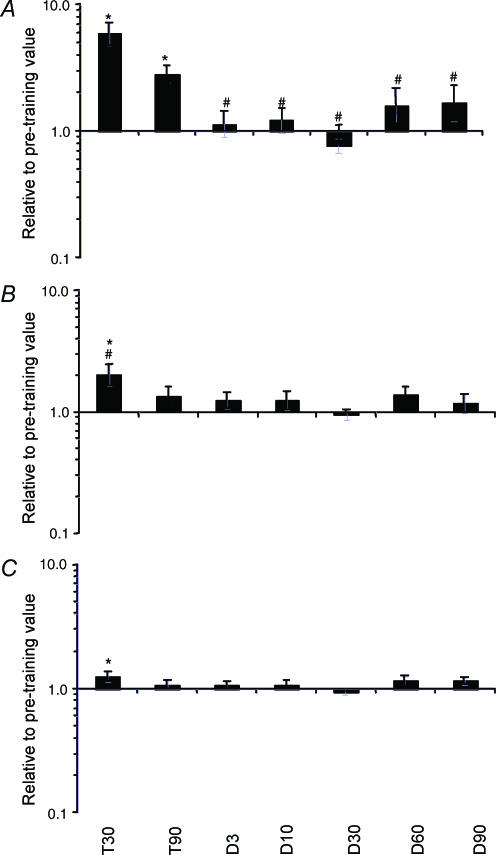
Figure 4. Quantification of p21 and CyclinD1 mRNA.
mRNA for the cell-cycle markers p21 (A) and CyclinD1 (B) and the 28S rRNA (C) after 30 (T30) and 90 (T90) days of training and following 3 (D3), 10 (D10), 30 (D30), 60 (D60) and 90 (D90) days of detraining. The RNA levels are normalized to GAPDH mRNA and are relative to the pre-training value for each subject. * Significantly different from pre-training value (pre-training value = 1); # significantly different from T90.

