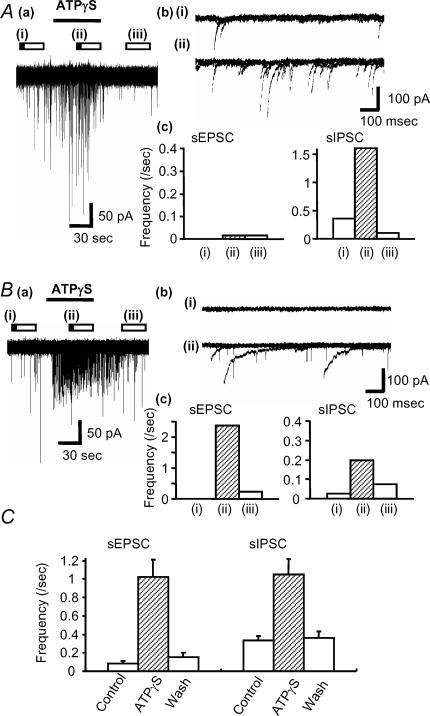
Figure 3. ATPγS can evoke transient facilitation of sEPSC- and sIPSC-frequency.
A, ATPγS increased sIPSCs frequency only in this MNTB neurone. Aa, ATPγS was applied during the period indicated by the horizontal bar. Ab, overlaid traces (5 sweeps) are shown for control (i) and during the application of 100 μm ATPγS (ii). Ac, summary of ATPγS-mediated frequency changes for sEPSCs (left) and sIPSCs (right) in this cell. The bar graphs shows the frequency in control (i), and during the application of 100 μm ATPγS (ii) and after wash (iii) in the period indicated by the bars in a. B, ATPγS evoked facilitation of both sEPSC and sIPSCs frequency in this MNTB neurone. Ba, example traces showing the effect of ATPγS. Bb, overlaid traces (5 sweeps) are shown for control (i) and during the application of 100 μm ATPγS (ii). Bc, bar graphs show the change in sEPSC and sIPSC frequency in control (i), on application of 100 μm ATPγS (ii) and following wash (iii). C, summary: each column indicates the mean ± s.e.mean from 56 (sEPSC) and 24 cells (sIPSC). Open bars above the data trace indicate analysis epochs, with illustrated traces corresponding to times indicated by the filled portion of the bar in this and subsequent figures.

