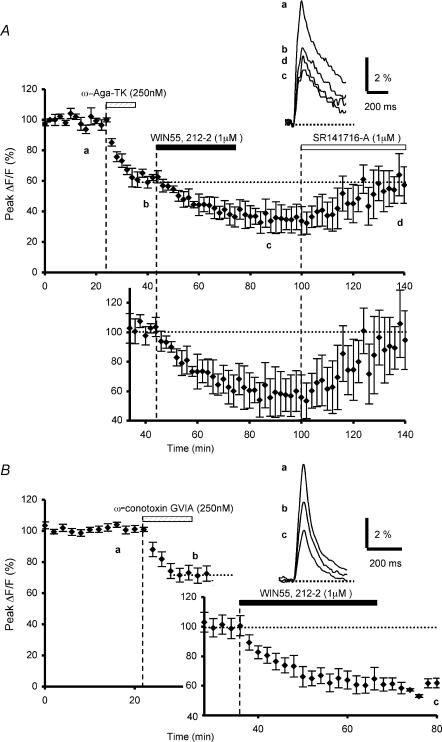
Figure 1. Effects of ω-agatoxin TK or ω-conotoxin GVIA preapplication on WIN55,212-2-mediated inhibition of presynaptic calcium influx.
A, the plot represents the normalized amplitudes of peak fluo-4FF fluorescence transients (ΔF/F) evoked by 5–7 stimulations (delivered at 100 Hz) of the parallel fibres recorded as a function of time, before, during and after sequential bath application of ω-agatoxin TK (250 nm) and WIN55,212-2 (1 μm). Each point is the mean ±s.e.m. of 4 separate experiments. Note that the inhibitory effect of WIN55,212-2 (1 μm) on the normalized amplitude of peak fluorescence transients was reversed by bath application of the selective CB1 antagonist SR141716-A (1 μm, n = 4). The top inset displays superimposed averaged fluorescence changes in one of these experiments, recorded at the indicated times. Each trace is an average of 5–10 consecutive trials. The bottom inset (graph) shows the WIN55,212-2-mediated reduction of the fluorescence transients normalized to the plateau level obtained after application of ω-agatoxin TK. B, the same as in A with sequential application of ω-conotoxin GVIA (250 nm) and WIN55,212-2 (1 μm) (n = 6). Insets as in A. Note that preapplication of ω-agatoxin TK or ω-conotoxin GVIA does not prevent the WIN55,212-2-mediated depressant effect on presynaptic Ca2+ influx.

