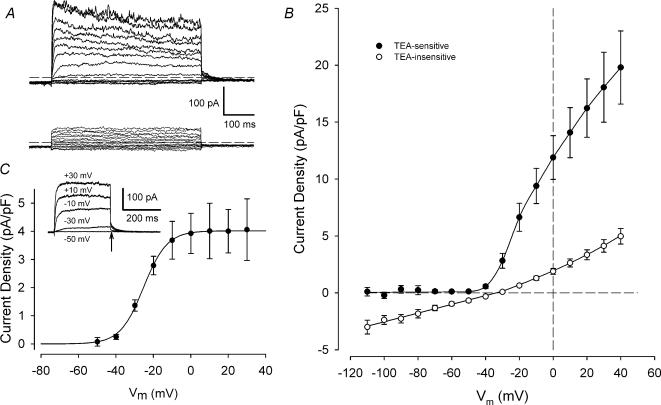
Figure 3. Current—voltage relations for ‘TEA-sensitive’ and ‘TEA-insensitive’ membrane currents.
A, family of currents from voltage-clamped chondrocyte before (upper records) and after (bottom records) exposure to 25 mm TEA. Voltage-clamp protocol was similar to that shown in Fig. 1A, except the depolarizing steps were 500 ms in duration. B, mean I—V relationships for ‘TEA-sensitive’ and ‘TEA-insensitive’ currents in 15 chondrocytes. ‘TEA-insensitive’ currents were the currents remaining in the presence of 25 mm TEA; ‘TEA-sensitive’ currents were obtained by subtraction of control currents from ‘TEA-insensitive’ currents. Currents from each cell were normalized to cell capacitance, and then averaged. Mean cell capacitance was 5.3 ± 0.4 pF (n = 15). C, voltage dependence of activation of ‘TEA-sensitive’ current. The amplitude of the deactivating tail current (at a membrane potential of −55 mV) was measured as a function of the depolarizing step. Inset shows an example of a family ‘TEA-sensitive’ currents for a series of 300 ms depolarizing steps from −50 to +30 mV. Tail current amplitude was measured at the end of the depolarizing step (arrow). The plot shows mean (±s.e.m.) tail current density (pA pF−1) as a function of membrane potential for 8 cells. The continuous line is the best-fit Boltzmann function (see text), with V½=−25.2 ± 0.3 mV and S½= 6.3 ± 0.3 mV.

