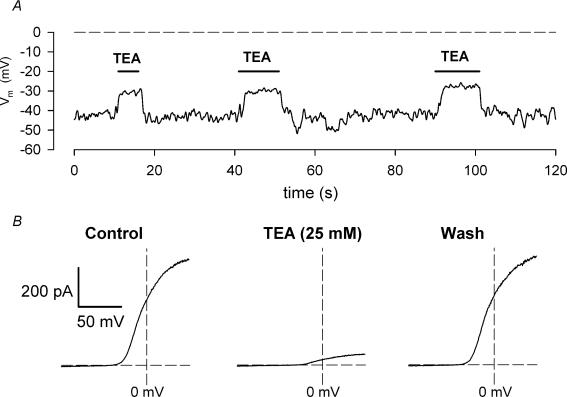
Figure 5.
A, effect of TEA on resting membrane potential of an isolated chondrocyte. The plot is a continuous recording of the membrane potential. Solution containing 25 mm TEA was applied to the cell for 3 successive intervals, as shown. B, current—voltage relations from the same cell, in control (left), in 25 mm TEA (centre) and after washout of TEA (right). The I—V relations were generated using a voltage ramp protocol (cf. Fig. 2).

