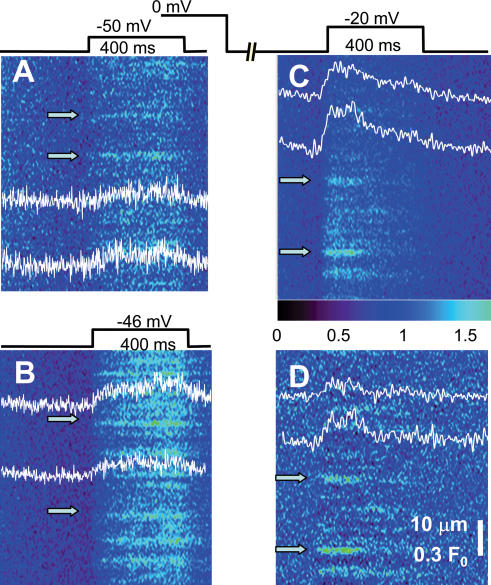
Figure 2. Events in middle pool ‘working’ regions, elicited by voltage clamp.
Fluorescence of fluo-4 in line scans parallel to the fibre axis. Scans were acquired while applying depolarization patterns shown schematically. Intensity normalized to resting fluorescence (averaged before the pulse). A and B, examples of responses to pulses to −50 and −46 mV (from a holding potential of −90 mV). Profiles were obtained averaging 7 central pixels at positions indicated by arrows. (Identifiers: 102102A13, 102102A2; fibre of Fig. 1B.) C, example of records obtained at a higher voltage after partial recovery from voltage-dependent inactivation (2.8 s at −90 mV). D, image in C after subtraction of global fluorescence (see Methods). (Identifier: 102802A28.)

