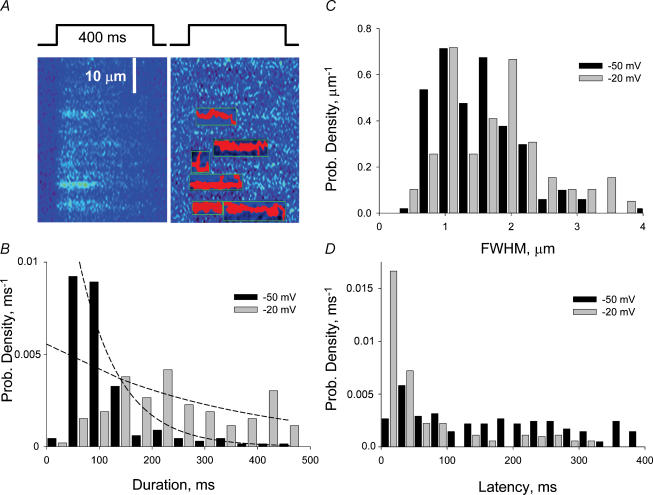
Figure 3. Morphological properties of events at different voltages.
A, the operation of the automatic event detector, which identifies events and measures them. Marked in red is each event's suprathreshold footprint, and in green its x and t bounds. B, distributions of event durations. Curves represent best single exponentials fitted to the histograms (with two first bins omitted). Time constants of fits are 77.5 and 330 ms. C and D, histograms of FWHM and latency from start of the pulse. ‘−50 mV’ data pool all events (168) at −46, −48 and −50 mV. ‘−20 mV’ are events (66) from images at −20 mV after recovery times at −90 mV of 2.6, 2.8 or 3 s.

