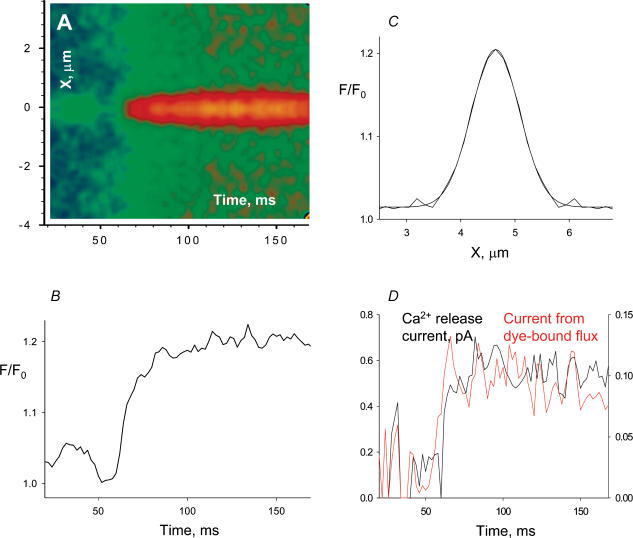
Figure 4. The average voltage-elicited event.
A, average of all normalized events that had (average) amplitude greater than 0.120 and duration greater than 100 ms. Events averaged (66) are from both fully and partially reprimed fibres. B, spatial profile of event, averaged between 50 and 100 ms after the first suprathreshold point. The smooth curve is a Gaussian best fit, of FWHM = 1.08 μm. C, temporal profile, obtained averaging 5 central pixels. D, black trace, Ca2+ release current, calculated from the average event; red trace (r.h.s. scale), dye-related component of the Ca2+ release current.

