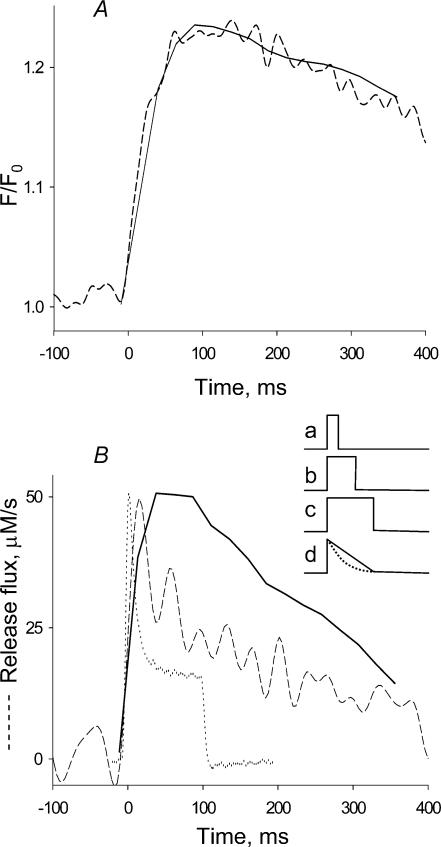
Figure 6. Fluorescence and release flux built as sum of elementary events.
A, dashed trace, global fluorescence, average over spatial coordinate of the image in Fig. 2B. Continuous trace, reconstruction of global fluorescence from elementary events as described in Methods. B, dashed trace, time course of release flux derived from the fluorescence record in A by the removal method of Melzer et al. (1984). Continuous trace, reconstruction of release flux by convolution (eqn (1) in Discussion) of the latency distribution L(t) and the elementary release E(t) (time dependence given by eqn (A2) in the Appendix). Dotted trace, time course of release flux at −20 mV, derived from photometric records in a ‘whole-cell’ experiment with a fully polarized fibre (record rescaled from Fig. 4B of Shirokova et al. 1996). Inset, the average time course of individual release current, E(t), results from averaging individual events of constant current and variable duration (represented by traces a–c). When a uniform distribution of durations is used, the result is the triangular record d (continuous line), obtained with eqn (A1). For a decaying exponential distribution of durations (with time constant 100 ms) the result is d (dotted line), obtained with eqn (A2).

