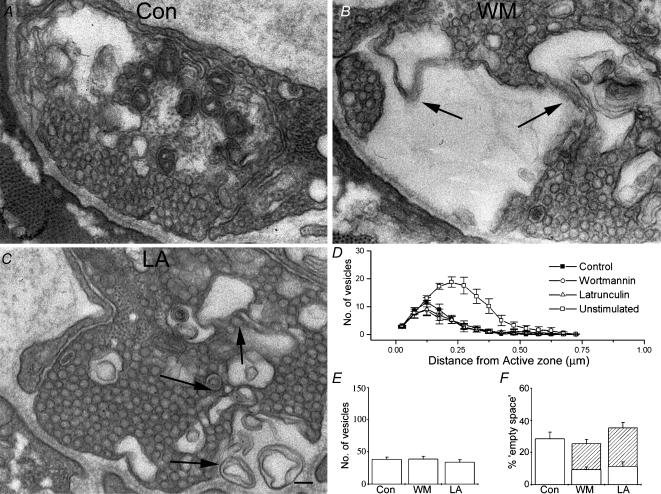
Figure 6. Both latrunculin and wortmannin perturb the morphology of stimulated nerve terminals.
A, a typical electron micrograph of a control nerve terminal following stimulation. B, wortmannin treatment, coupled to stimulation, results in a severe perturbation of nerve terminal ultrastructure. Arrows indicate unusual multilamellar membrane structures seen in these and latrunculin-treated preparations following stimulation. C, an electron micrograph of a latrunculin-treated preparation. Again, arrows indicate morphological abnormalities. In all cases (A, B and C) the ultrastructure is altered compared to resting terminals. In controls this was predominantly seen as a loss of vesicles and the appearance of endocytic intermediates (cisternae). In both wortmannin-treated and latrunculin-treated preparations, in addition to the loss of vesicles, complex membrane structures were often evident. Scale bar = 100 nm D, quantification of numbers of vesicles plotted against distance from the active zone. No significant difference was seen between treatments. Control distribution is plotted again from Fig. 5B for purposes of comparison. E, total number of vesicles seen in terminals for each treatment. F, ‘empty space’ seen in nerve terminals (open sections of bars) and complex membrane regions (hatched sections of bars). The failure of wortmannin- and latrunculin-treated preparations to match the increase in empty space seen in control preparations (P < 0.01) is explained if one considers the area occupied by the complex membrane regions. As in Fig. 5, data plotted in panels B–D are mean values obtained from >20 terminals, from 5 preparations each.

