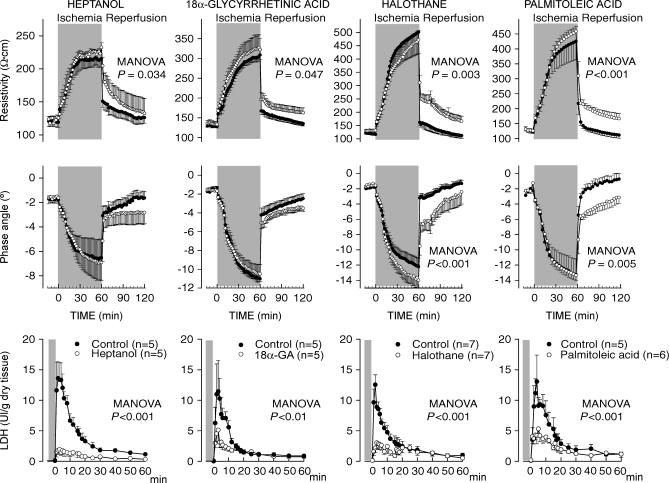
Figure 2. Changes in electrical resistivity and phase angle during ischaemia–reperfusion, and LDH release during reperfusion, in control isolated rat hearts submitted to 60 min of ischaemia–reperfusion and in hearts treated with different inhibitors of GJ mediated communication during the first 15 min of reperfusion.
Concentrations of GJ inhibitors were as follows: heptanol: 10−3 m; 18α-glycyrrhetinic acid: 10−5 m; halothane: 10−3 m; and palmitoleic acid: 3·10−5 m. The P value shown in each graph indicates the MANOVA P value.

