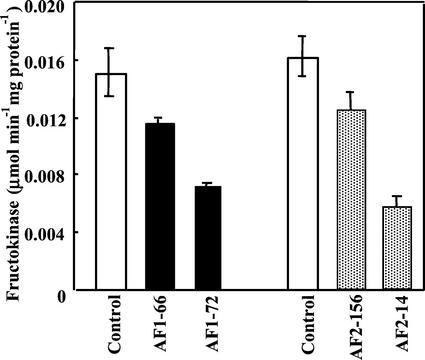
Figure 2.
Fructokinase activity in leaves of transgenic and control plants. Fru concentration in the assay was 50 mm (antisense Frk1 lines, black columns) and 0.5 mm (antisense Frk2 lines, gray columns) that were optimal for Frk1 and Frk2 activity, respectively. Bars represent ±se calculated from six times extraction from leaves of three to four plants per line.

